
Core Web Vitals explained
By MayreDukaan Research · Researched 2026-11-17
Core Web Vitals are Google's field metrics for three aspects of web experience: loading performance, responsiveness and visual stability. The current metrics are Largest Contentful Paint, Interaction to Next Paint and Cumulative Layout Shift. Their abbreviations are LCP, INP and CLS. Each measures something different, so a fast-loading page can still respond slowly to input or shift its content unexpectedly. [Source: web.dev, Web Vitals.]
The diagram groups the published thresholds into good, needs improvement and poor. Read each metric in its own unit rather than comparing the raw numbers across columns. Web.dev recommends evaluating the 75th percentile of page visits, segmented between mobile and desktop. This makes the assessment about a distribution of actual experiences, not one unusually fast test run or one developer's computer. [Source: web.dev, threshold methodology.]
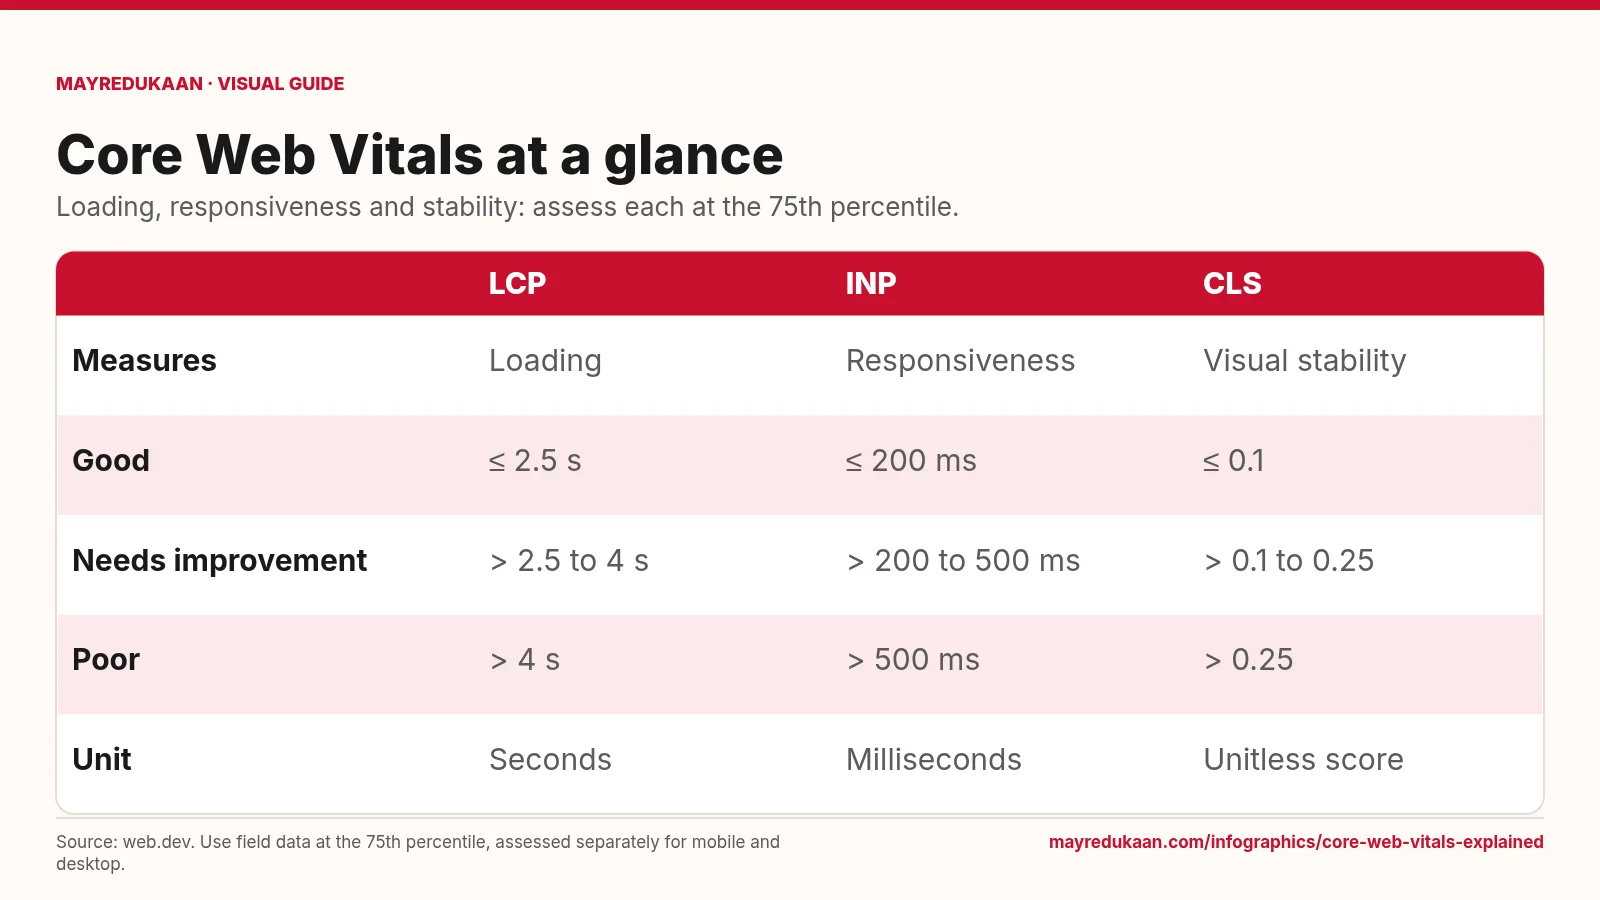
What the diagram shows
| LCP | INP | CLS | |
|---|---|---|---|
| Measures | Loading | Responsiveness | Visual stability |
| Good | ≤ 2.5 s | ≤ 200 ms | ≤ 0.1 |
| Needs improvement | > 2.5 to 4 s | > 200 to 500 ms | > 0.1 to 0.25 |
| Poor | > 4 s | > 500 ms | > 0.25 |
| Unit | Seconds | Milliseconds | Unitless score |
Source: web.dev. Use field data at the 75th percentile, assessed separately for mobile and desktop.
Read the loading and responsiveness columns
The LCP column represents loading performance: it marks when the largest eligible visible content element is rendered. Its good threshold is at most 2.5 seconds. Values above 2.5 seconds through 4 seconds need improvement, and values above 4 seconds are poor. The INP column represents responsiveness to user interactions over the page visit. Its good threshold is at most 200 milliseconds, values above 200 through 500 milliseconds need improvement, and values above 500 milliseconds are poor. INP concerns the delay until the next paint following an interaction, not the total time for every asynchronous consequence of that interaction to finish. [Sources: web.dev, Web Vitals and INP.]
Read the visual stability column
The CLS column describes visual stability rather than loading time or interaction latency. Its score is unitless, which is why the diagram does not put seconds or milliseconds after the values. A score of at most 0.1 is good. A score above 0.1 through 0.25 needs improvement, and a score above 0.25 is poor. CLS measures unexpected layout shifts, so it addresses the experience of visible content moving rather than simply the amount of content on a page. Treat the column as a separate diagnostic: a good loading result does not establish that the layout is stable. [Source: web.dev, threshold methodology.]
Apply the thresholds to field measurements
The table's category boundaries apply to the 75th-percentile value for each metric in field data. Web.dev recommends separating mobile and desktop experiences because those populations can have different performance. To pass the Core Web Vitals assessment, all three metrics must meet their good thresholds at that percentile. Laboratory tools remain useful for reproducing problems and checking changes, but a single lab run is not a substitute for the field assessment. Read the metric names, units and population alongside the result before deciding what to fix; otherwise, an apparently improved test score can obscure a different problem experienced by real visitors. [Source: web.dev, Web Vitals.]
Key facts
- The current Core Web Vitals are LCP, INP and CLS.
- Good LCP is at most 2.5 seconds.
- Good INP is at most 200 milliseconds.
- Good CLS is at most 0.1 and has no time unit.
- The recommended assessment uses the 75th percentile of field measurements.
Frequently asked questions
Is exactly 200 ms a good INP?
Yes; the good INP threshold includes 200 milliseconds.
Does CLS measure seconds?
No; CLS is a unitless visual-stability score.
Does one good metric mean the assessment passes?
No; all three metrics must meet their good thresholds at the 75th percentile.
Related free tools
Sources
- web.dev: Web Vitals — accessed 2026-11-17
- web.dev: How Core Web Vitals thresholds were defined — accessed 2026-11-17
- web.dev: Interaction to Next Paint — accessed 2026-11-17
More visual guides
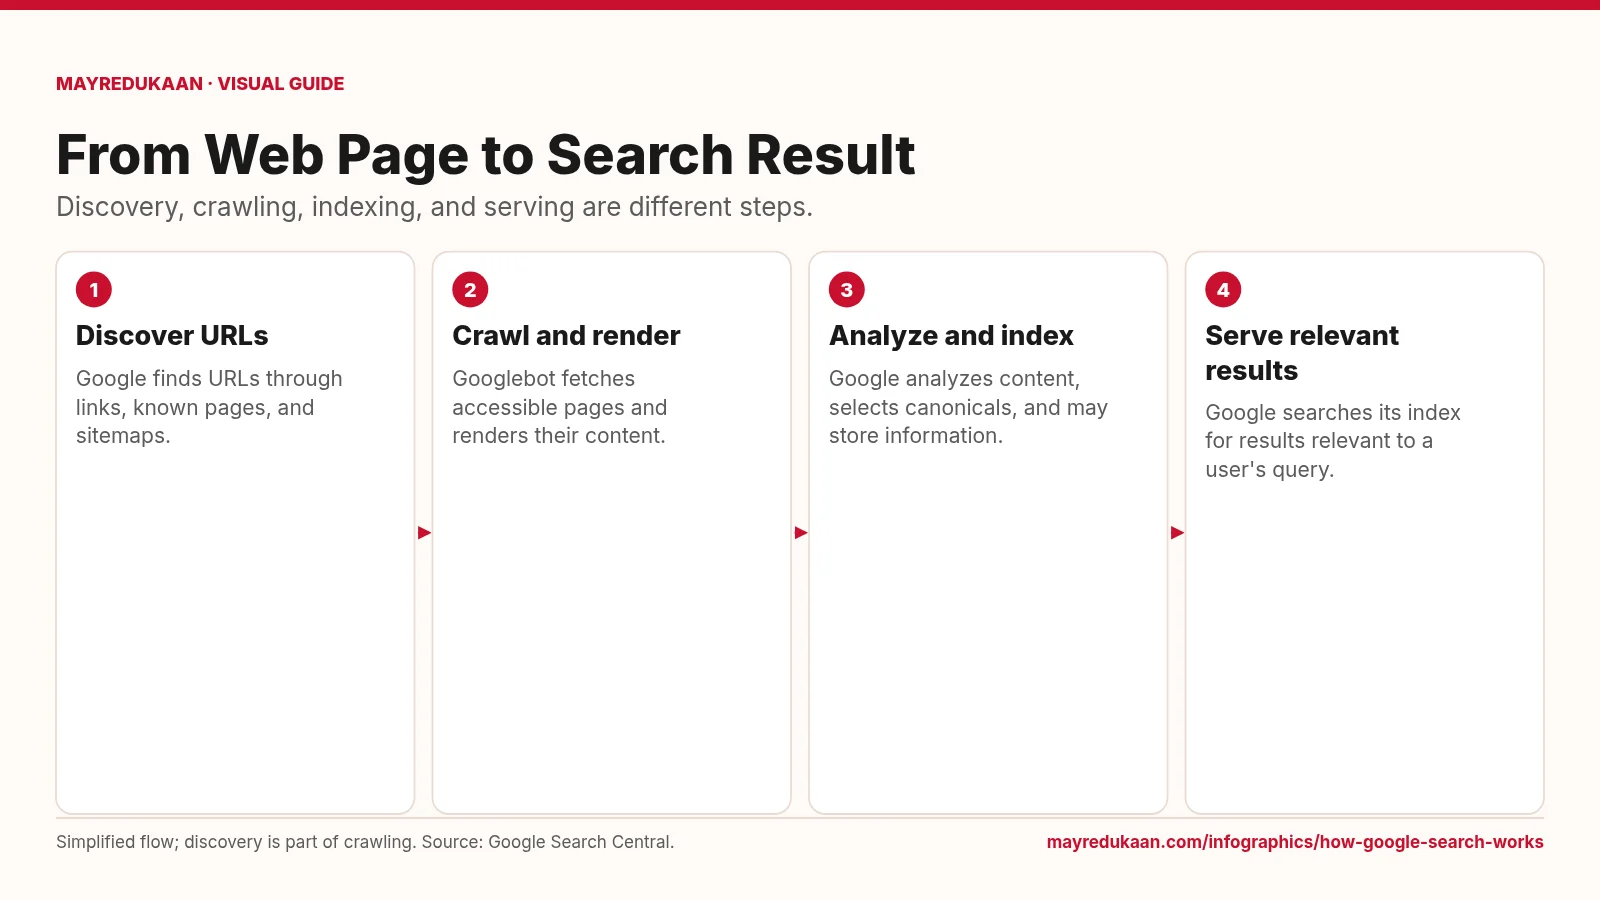
How Google Search Works
A page must be discovered and processed before its information can compete to appear for a search.
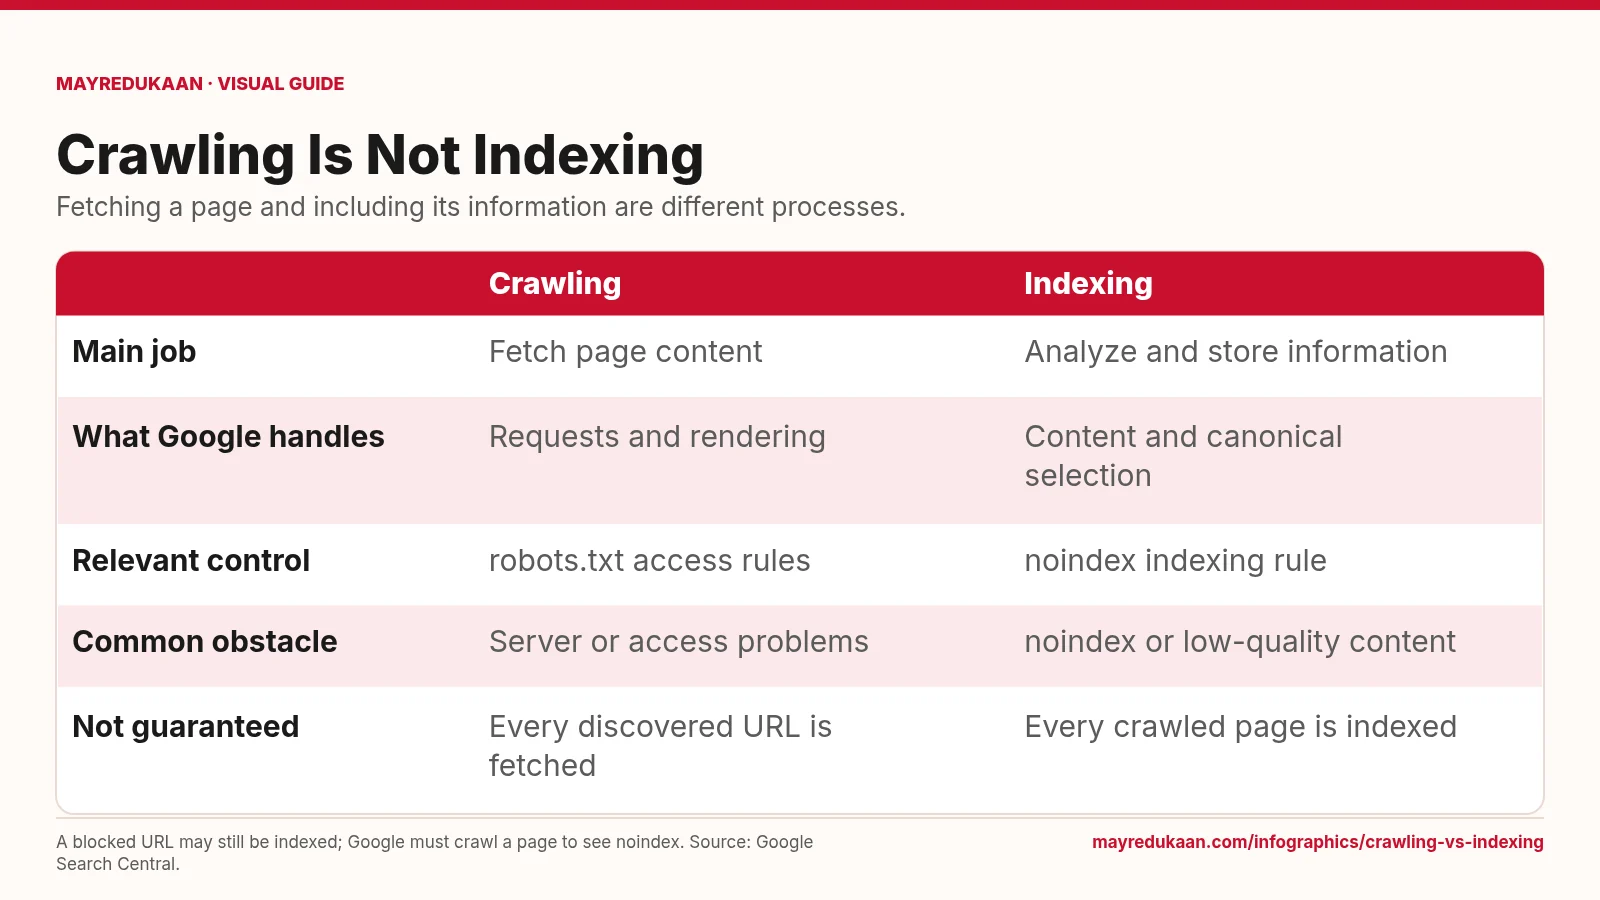
Crawling vs Indexing
Use crawl controls for fetching and indexing rules for whether content belongs in Search.
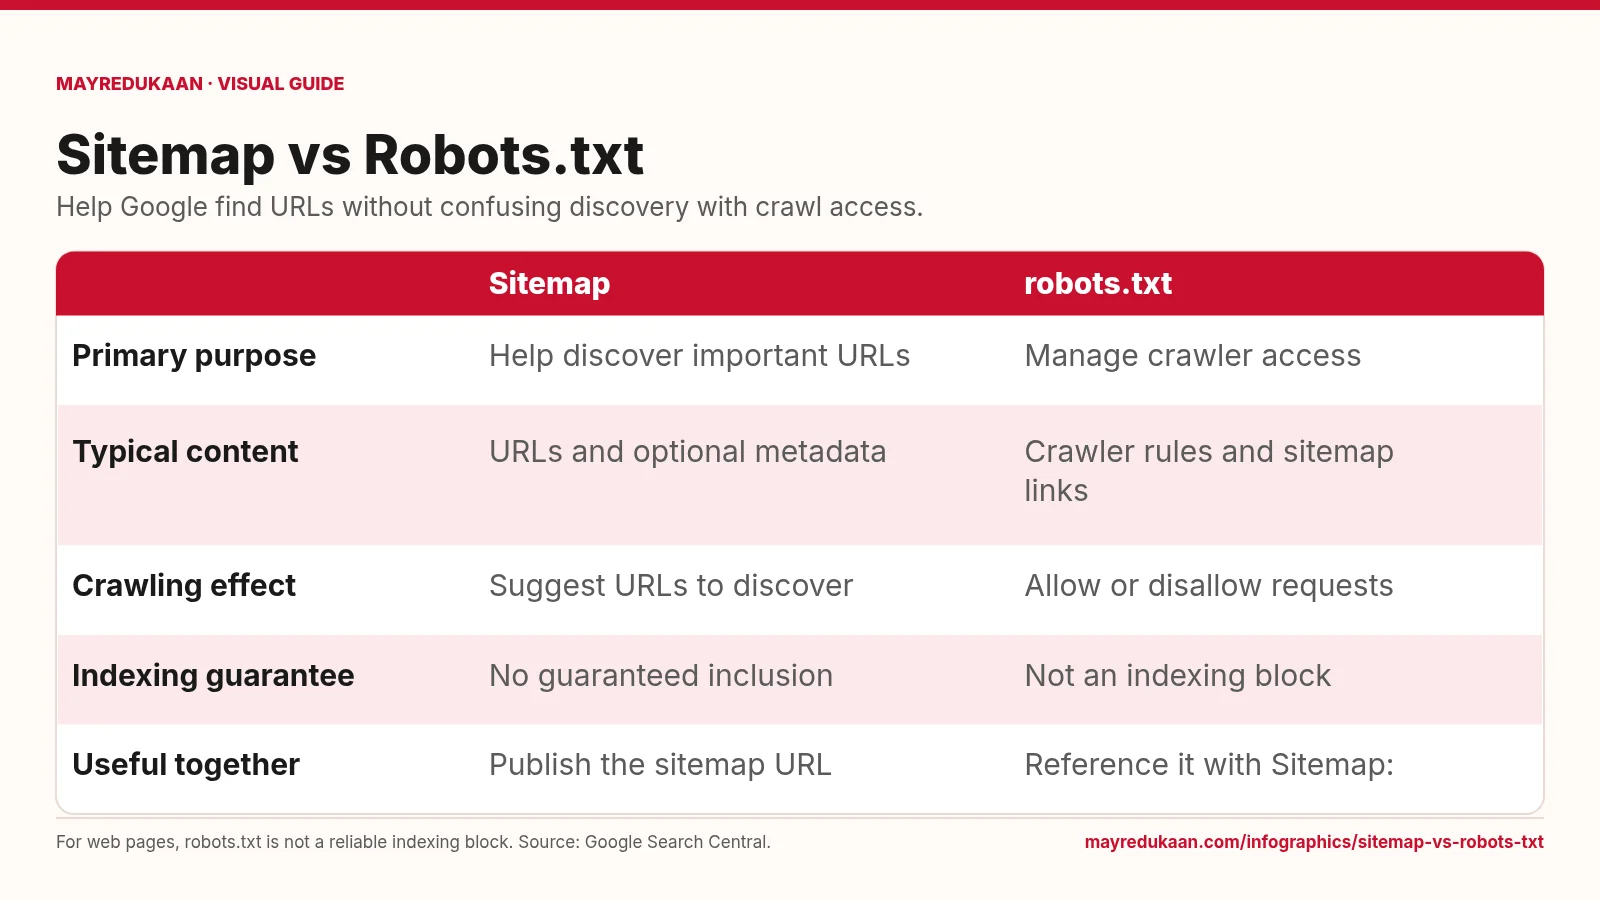
Sitemap vs Robots.txt
Sitemaps support URL discovery, while robots.txt sets crawl-access rules for compliant crawlers.